How to use Google Analytics
If you have a website or a blog whether it’s for business or personal use, then you should be using google analytics. If you want to see how many people are visiting your site, who is visiting, where are they coming from and what they are doing while on the site then Google Analytics is the perfect tool for the job and its completely free.
How to set up Google Analytics
First of all, you need to make sure you have a Google account, this is used for Gmail, YouTube, Google Drive and others. So, if you don’t have one, make one now
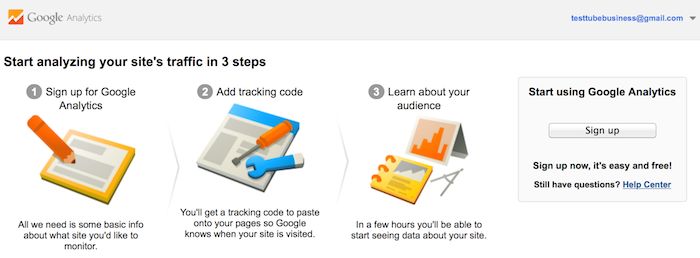
From there you go to the Google Analytics website, click here.
You will be shown some thing like this
Click sign up where you will have to insert all your website and contact details
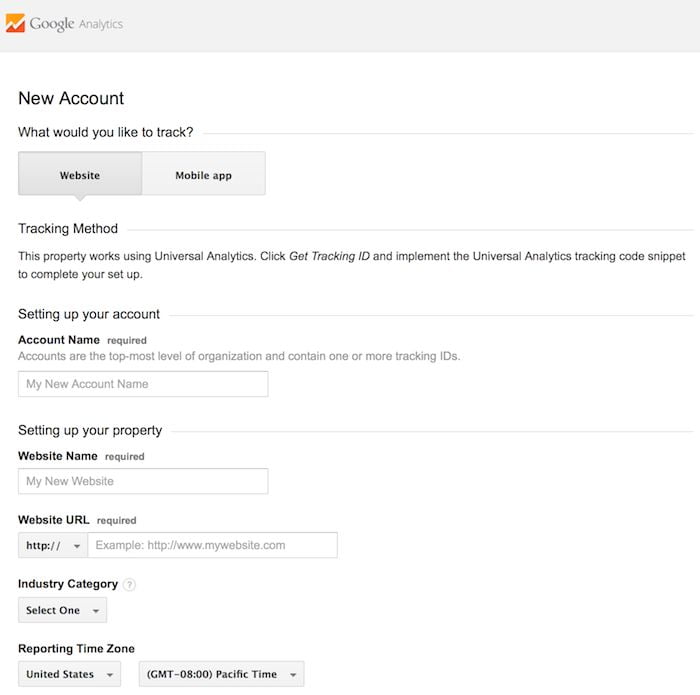
It will look something like the image above, make sure you insert all the details correctly, otherwise you won’t be able to connect.
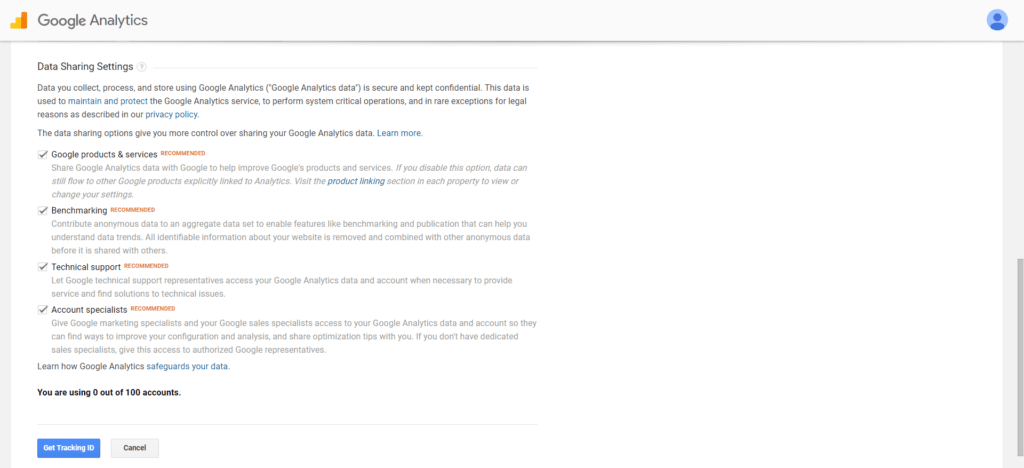
Once you finish, click “Get Tracking Id”, you will need to confirm you agree to everything, make sure you put you are in the correct country
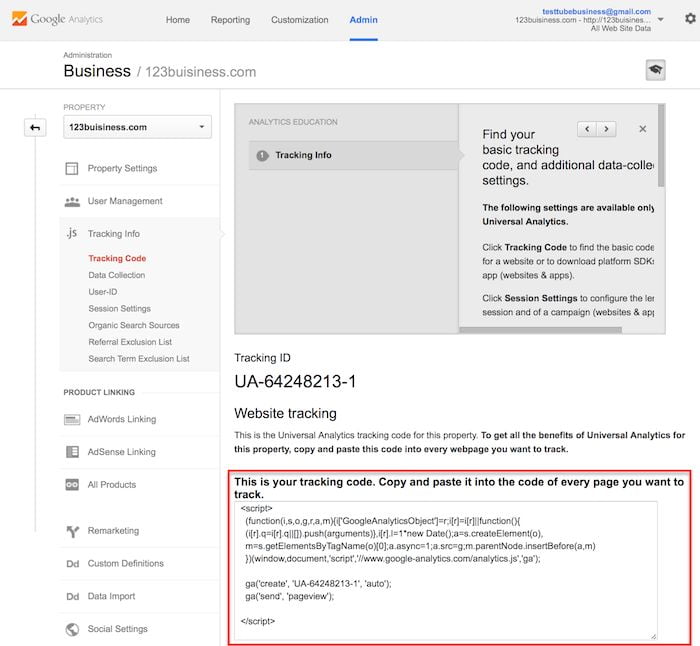
You will then be shown a page that looks like this, the long number is your tracking ID. The area highlighted in red is the bit you need to put into your website. This code needs to be inserted into every page that you want tracked. I know this bit may put a lot of people off, but please give it a go, its not as hard as it looks!
If you are using WordPress simply download the plugin “Google Analytics by Yoast plugin”, where you simply insert into the shown field.
If you are using Weebly, Log in and click Edit Site. Go to the Settings tab and select the SEO section. Paste the code into the area that says, “Header Code”. Then press save, it’s that easy!
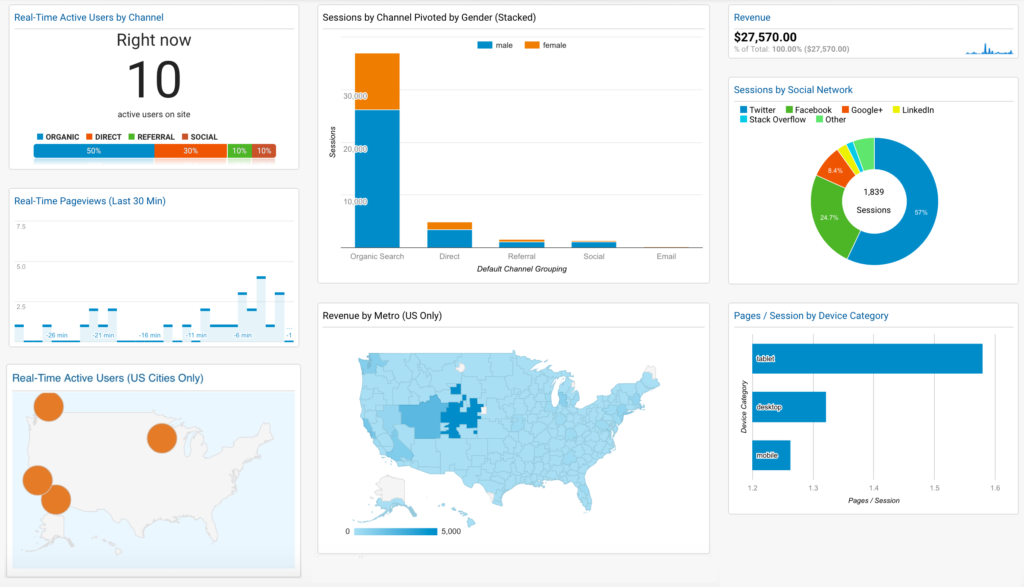
Once you have added the code the data should start appearing after a short wait. You will start seeing some interesting data about your audience.
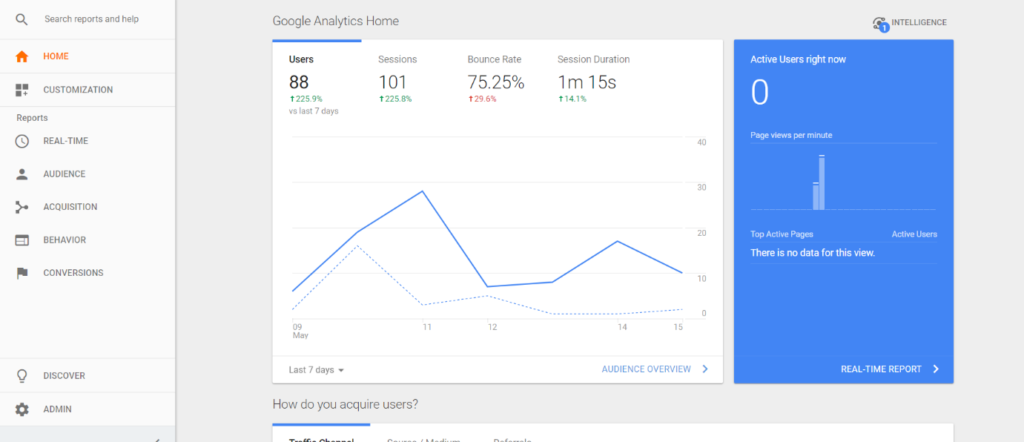
Here for example you can see the number of users that have visited the site in the last 7 days is 88, which is up by 225% compared to last week showing that the website is getting more views.
Sessions is the number of times a user has interacted with the site, this normally means that they have clicked on another page. Bounce rate is when someone goes on your site then leaves quickly, you want this to be as low as possible. Session duration is how long, on average, each user spends on your site. You want this to be as long as possible.
On the right of this main graph is the number of active users. The screen shot above shows that there are no current active users on the site, but if you look below that you can see there was a few active not to long ago.
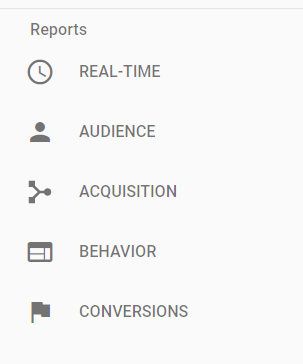
I will briefly explain what each area does that you see along the side.
Real-time: Here you can see what your current active users are doing in real time as they do it. Creepy right? But interesting and valuable. You can see what country they are from, what page they are on, how long for, what they are clicking on, and a lot more
Audience: This is a great area as it allows you to see where your audience is coming from, including country and city. It shows how they are viewing your site such as from a desktop or mobile phone and even what internet browser they are using. It allows you to look at age, gender, if they are returning visitors or completely new ones and the flow in which they use your site. This is a great way of finding out who you should be targeting your content at.
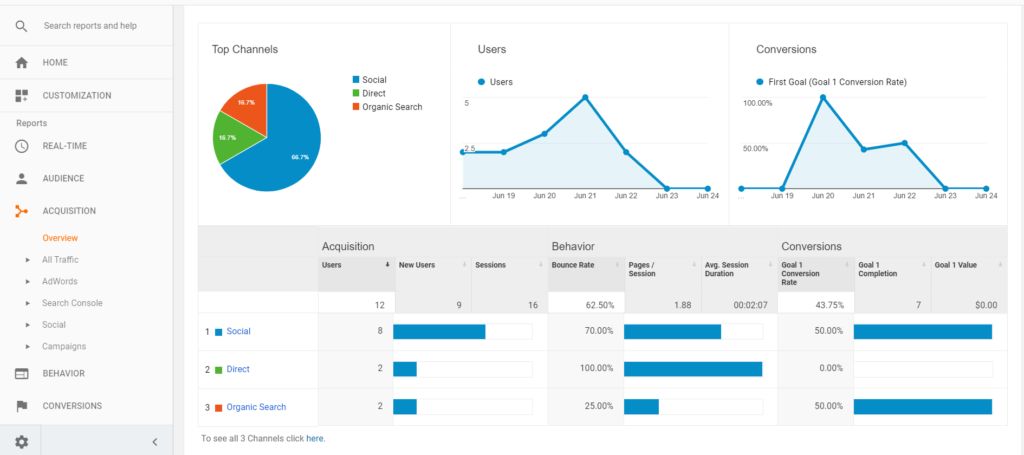
Acquisition: This mainly focuses on where your traffic is coming from, whether its through organic search, social media or referrals. This is useful for finding out how you can better improve traffic and what is working best. You can also see what kind of keywords people are using to find your website.
Behaviour: Is a very useful area that allows you to see what exactly your audience is doing, this shows what pages are most popular and where they go from each page. For example, on my website I found out that a lot of people go from my Homepage to my About page, this told me that I need to focus more on my about page as lots of people was visiting it. It also shows where your visitors are dropping off meaning they may not like a page or they are not engaged enough.
Conversions: This page is mainly for website that sell products. It allows you to analyse what pages are working best for selling your products. It gives you statistics such as what days are the best for selling and what time you sell most. Its good for keeping track of your products.
All the different sections provide a great insight into what your website is doing right or wrong. Finding out where your customers are leaving your website could be the difference between making a sale or loosing a customer. Anyone that has a website should be using this tool to help grow their audience and target them better.
There are so many different areas that can be looked at which can be confusing and overwhelming but its worth looking into for further detail. I personally enjoy just looking at the stats from my site and seeing what works best to drive traffic. But again there are loads of features that I haven’t covered here so just try it out and see what works best for you.
If you want more information about how to get more traffic to your website read my other blog post here!
Or if you want to read any more posts take a look at my blog posts page here
Thanks for reading! Please like or comment if you enjoy this post or found it useful thanks!